How can I simplify data center power monitoring?

A guide to take advantage of the data center power monitoring system in EkkoSoft Critical and the powerful new sidebar visualizations by Lee Williamson, Customer Support Manager at EkkoSense
EkkoSoft Critical is all about helping customers optimize data center performance to previously unachievable levels. With the latest major EkkoSense release, we focus on making sure that users have all the capacity, power and cooling data and visualizations they’ll need to get there even more quickly.
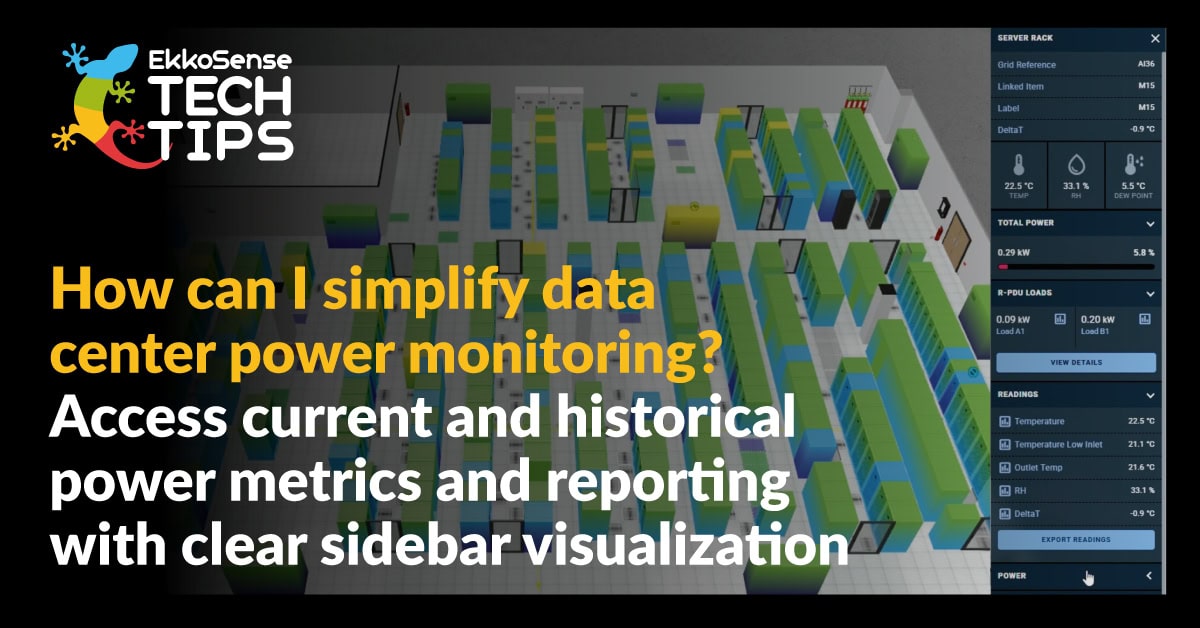
A key new feature in EkkoSoft Critical is the introduction of clear sidebar visualization and reporting. They now provide clearer information and historical visualizations of peak values.
As data center complexity increases, there’s never been a greater requirement for critical data center infrastructure alerting. This can give operations teams the early insights they need into potentially critical issues. Clear visuals and simple, 1-click reports all combine. Operations teams now have immediate access to data that was simply unavailable from traditional BMS platforms.
EkkoSoft Critical now features a consolidated enterprise dashboard that gives operations teams estate-wide access to their critical power management data and key power metrics within the sidebar window.
In this new Tech Tips video we show just how easy it is to find out exactly how much power is being used – either at an individual or multiple rack level. This can also be tracked over a historical period, providing a quantifiable record of power usage over time.
1-min Tech Tips video: How our power monitoring system for data centers can:
- Track individual power loads on each rack
- Monitor power loads across rooms as well as wider enterprise estates
- View rack environmental data and power usage
- Check rack or room power usage and capacity against agreed power allocations
- Track power usage over selected timeframes to view historic data and enable further analysis and optimization
- And expand timeframes for further insight
Watch the Sidebar Power Visualization Tech Tips video here. And if you want to find out more about how EkkoSoft Critical provides a perfect data center power monitoring system and go-to-optimization tool, book a 1:1 demonstration. And.. look out for the next Tech Tip where we’ll be focusing on ‘How to Generate Custom Rack Reports’.