DCD New York : Show and Tell for Data Center Operations

Find out more about EkkoSense at DCD New York or book a 1:1 strategy meeting here
For adults of a certain age, the words “show” and “tell” should carry a certain nostalgic quality. Early in elementary school, show-and-tell was our first venture into public speaking, where we stood in front of the class and discussed something in our lives that we liked. Life priorities were simpler then, so mine was an original Optimus Prime (Transformers) action figure, which reveals I’m closer to Social Security than I would prefer.
Over time, the term has become part of business language. Show me, don’t tell me reinforces the value of visualization, that seeing is believing, that signals are more easily seen visually than buried in lengthy paragraphs or monologues. Such is the goal of any business intelligence dashboard—actionable insights digested quickly.
Why data centers need both
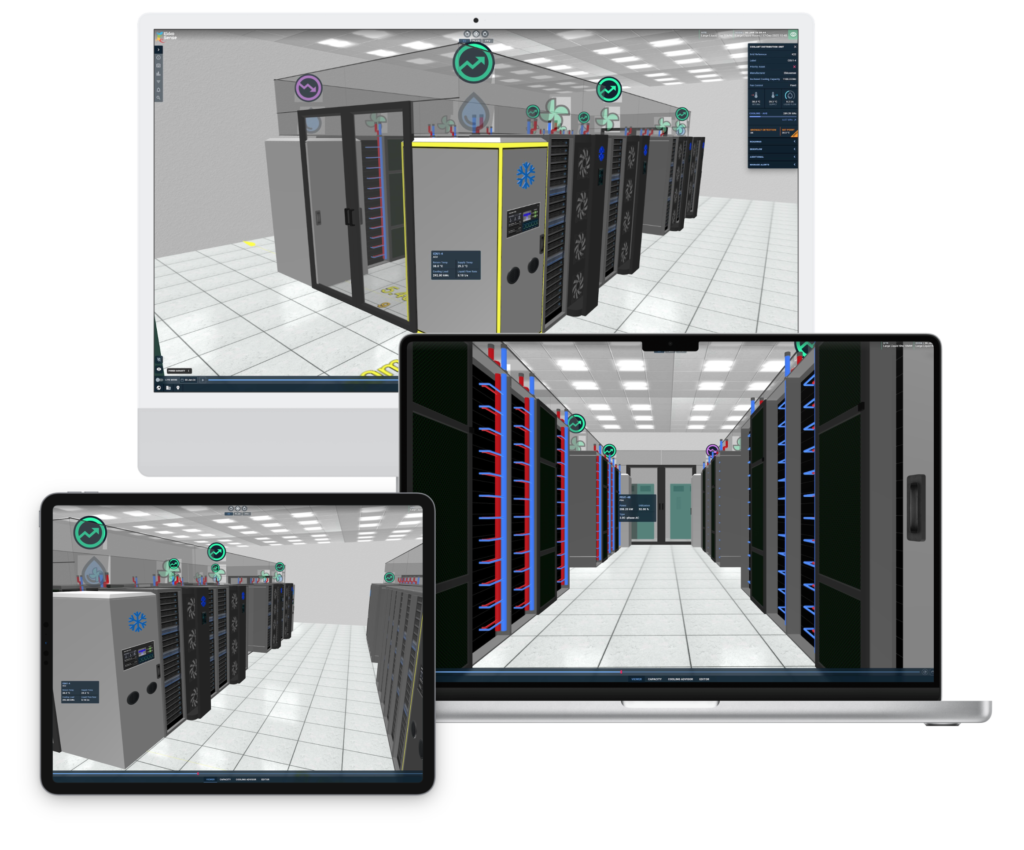
Complex environments, especially data centers, need a balance between show and tell. While the scale still tips heavily toward showing & visualization, telling, when packaged the right way, is perhaps the more powerful of the two. EkkoSense’s flagship product, EkkoSoft Critical, is created in this spirit: showing the current state of the data center; understanding, through AI, the invisible relationships at play; and clearly, succinctly telling the owner how the facility can become the best version of itself.
How EkkoSoft Critical Shows and Tells
| Showing | Telling | |
| Rack Temperatures: expressive color coding of rack temperatures |  | ASHRAE or other operational compliance: number of racks within or beyond common temperature bounds |
| Cooling Utilization: real-time and historical capacity reported by the cooling units |  | Utilization Trend: Upward or downward movements; utilization “bins” to see cooling units lightly or fully loaded |
| Cooling Measurements: real-time and historical capture of temperatures, setpoints, humidity, airflow, and telemetry |  | Anomaly Detection: Proactive notification of potential problems |
| Cooling Zones of Influence: visual coding of CRAH & rack relationships |  | Cooling Advisor: tailored optimizations, underpinned by the Zones of Influence algorithm |
| Efficiency Measurements: charts/graphs for PUE, CUE, WUE, and others |  | ESG Reporting: combining all efficiency metrics into a curated report to share with stakeholders |
| Nominal and Active Capacities: Cooling, UPS Power, Utility Power |  | IT Deployment Recommendations: using EkkoSense Zone of Influence and real-time data to recommend the best location for new hardware or new racks |
To get where you’re going, you must know where you’ve been, the cliché goes. Most software will capture where you’ve been and where you are. But is that enough for today’s dynamic data center?
While no one has a crystal ball, EkkoSoft Critical provides an informed, targeted chart of possibilities of where you’re headed, from whitespace thermals and power to (soon) the chilled water systems. Capturing the basics (monitoring, alarming, trending) and building to next-level insights is the fabric of the EkkoSense approach. And, while we could easily tell you how, these visuals are worth a thousand words.
See EkkoSoft Critical in action
Book your demo or meet with the author Justin Blumling at DCD New York or book a virtual demo here.