EkkoSense’s 3D data center visual timelines tell the story

How did our data center sites do this summer? How much data center energy are we using? What really happened when we lost power that time – what were the specific reasons? Is the new cooling we installed working well? Should we be thinking about liquid cooling? Where are we going to place our AI compute racks? Did that investment we made last year deliver the results we were looking for?
Answering these kind of questions requires really precise answers, and comparing past and present data center performance has never been easy. It’s often difficult to look back in time for specific data points. Your traditional Building Management Systems can’t really help much here as they typically don’t measure or record data at a granular level.
Building Management System (BMS) output isn’t designed for data analysis
This usually means getting your operations team to go and find whatever records they can and, digging deep and hoping they source enough of the kind of data you’re looking for.. Unfortunately, BMS output isn’t designed for data analysis as they do not present data for engineering analysis, while existing reports can’t convey the whole story.
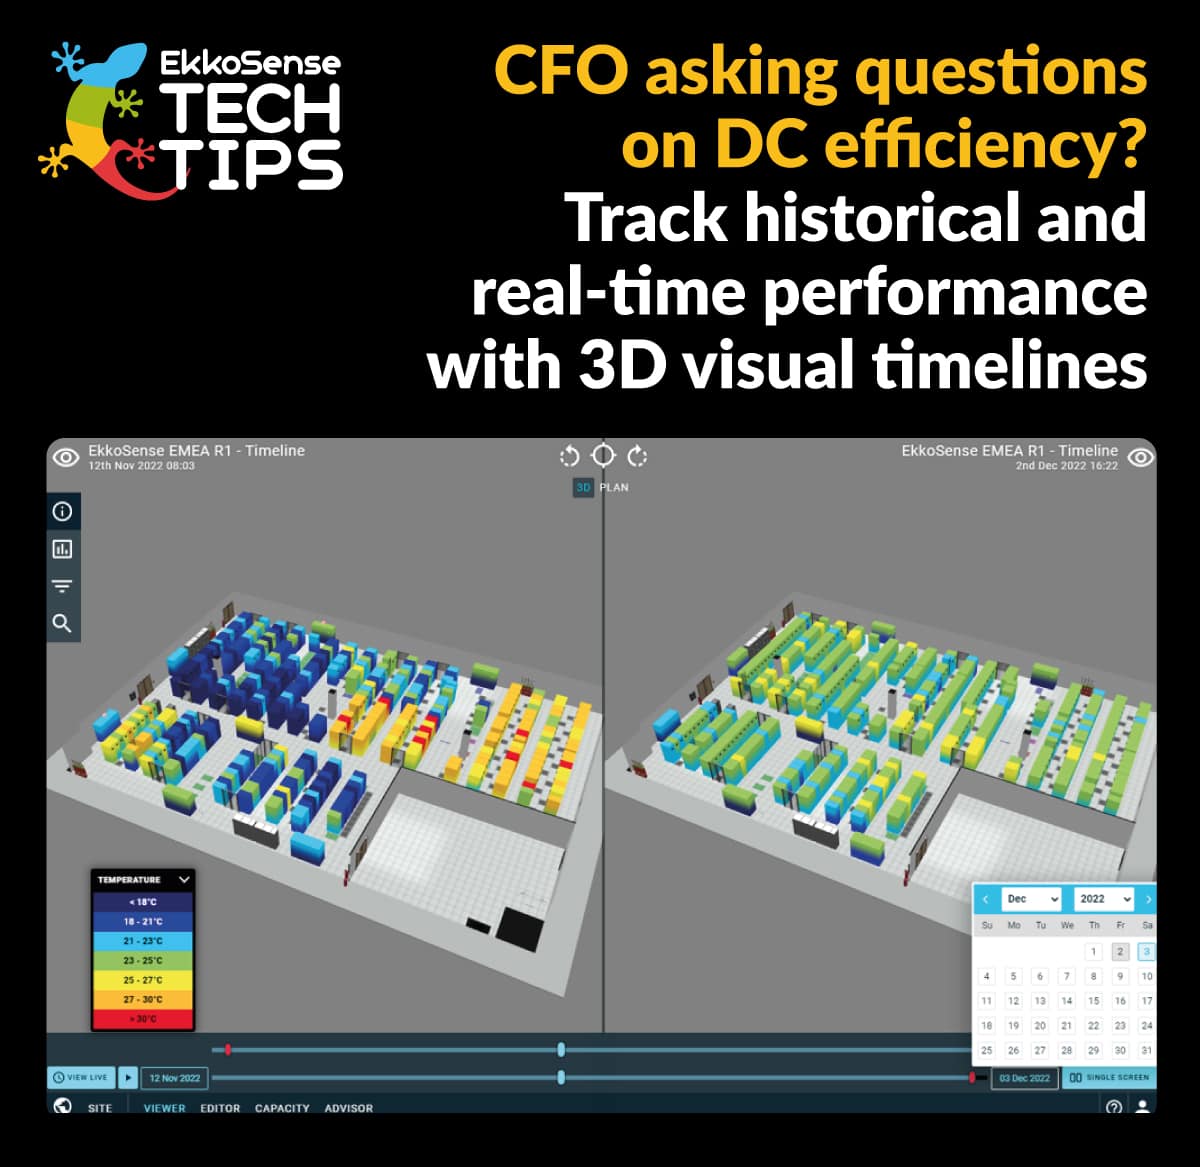
This is where EkkoSense and our EkkoSoft Critical software can make a huge difference. EkkoSoft Critical offers a 3D Visual Timelines capability that lets you track site performance in real-time. Our software records millions of data points to create an effective Digital Twin of your data center’s historical and live performance.
This means you can look back at any point in time to investigate site issues, in more detail. This can be to justify an investment, track the impact of hot weather, or settle a dispute with an infrastructure partner. It’s also a great way for colocation service providers to improve their technical dialogue with tenants. Meanwhile, for organizations pursuing continuous data center optimization, 3D Visual Timelines are a great way of demonstrating progress across a given period of time.
How EkkoSenses 3D data center visual timelines work
It couldn’t be any easier to use.
- First select any historical date
- Pick a time on the timeline
- Select the split screen mode so that you can compare any two points in time
- Try out the swipe mode features that make it easy to compare before and after
- See exactly what’s changed!
With EkkoSoft Critical’s clear 3D visualizations it’s much easier to explain exactly what’s going on across your data center estate. Also, comparative 3D timelines make the task much easier and quicker for data center operations teams.
Contact us to book a demo of our 3D visual timelines functionality so you have the information to hand to answer your CFO and Energy Managers questions.

For more know-how and tutorials from EkkoSense, your critical friend in the data center, visit ekkosense.com/resources/tech-tips