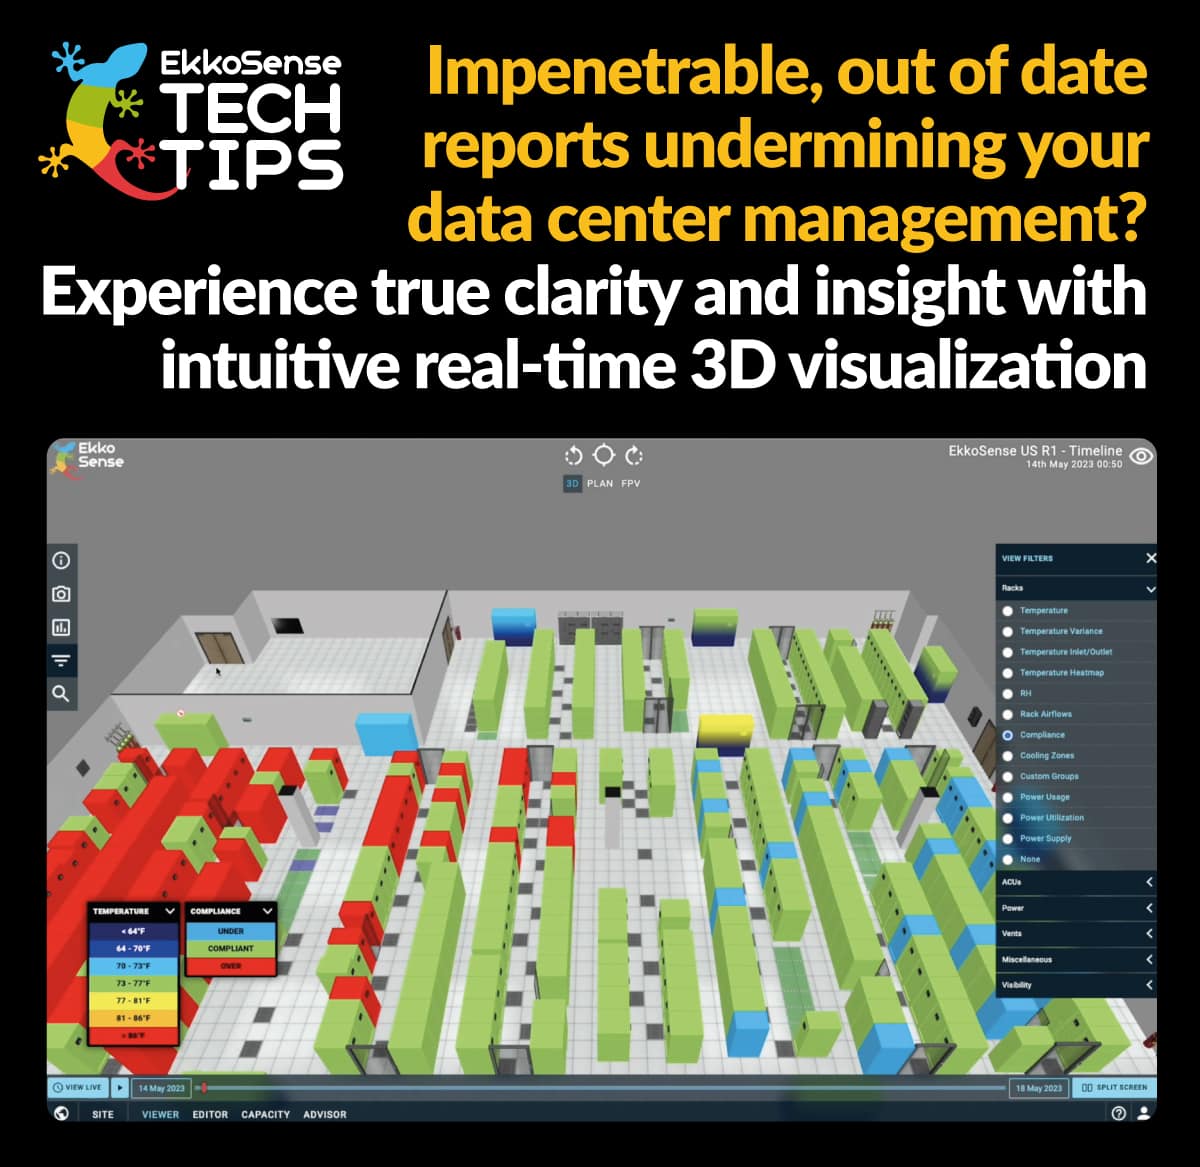
Data Center Optimization made easy with 3D visualization

Right from the start when Dr Stu Redshaw began to develop EkkoSoft Critical we focused on key capabilities – such as advanced 3D visualization, a real-time 360° view of all your critical cooling, power and thermal data, and 24/7 easy to use visibility via a ‘single pane of glass’. These features combine to make EkkoSoft Critical a truly disruptive alternative to traditional optimization approaches.
Our 3D visualization platform makes it extremely easy for operations teams to visualize data center cooling and airflow management improvements. It also makes it simple to manage previously complex cooling capacity decisions, and means you can quickly highlight any worrying trends in cooling performance.
What we also find is that as data center operations teams use EkkoSoft Critical to gain access to their heartbeat M&E data in 3D, they are able to re-invent often inflexible and time-consuming optimization processes for the better..
Take reporting as an example. Previously, data center engineering teams would have had to literally sift through hundreds of lines of raw BMS data to extract the information they needed to view rack temperatures. With EkkoSoft Critical, you just look at our intuitive 3D data center visualizations to get the information you need. And there’s no need to create separate reports – EkkoSoft Critical visualizations can be accessed from any device, resulting in a process that’s orders of magnitude faster, making EkkoSense the perfect go-to optimization tool for data center operations teams.
It is obvious, but because EkkoSoft Critical is a visual platform, it’s so much simpler to surface previously invisible information. Applying our Zones of Influence functionality, for example, allows operations teams to combine real-time cooling duties with rack-level thermal data. This provides dynamic insights into true cooling capacity, meaning you can drill down to find out why a certain area of a room may be getting hot.
Another great feature that benefits from 3D visualization is EkkoSoft Critical’s time-lapse capability that lets you compare your current data center profile with how things were a month or three months ago. It’s a brilliant way of helping non-technical colleagues to understand how things are changing and show what needs to be done.
EkkoSoft Critical really couldn’t be simpler. Watch our new Tech Tips video to see how easy it is to benefit from the software’s intuitive 3D visualizations. And go here for a free EkkoSense demonstration.

For more know-how and tutorials from EkkoSense, your critical friend in the data center, visit ekkosense.com/resources/tech-tips